Tutorial
Getting Started with Data Visualization Using JavaScript and the D3 Library

Introduction
D3.js, or D3, is a JavaScript library. Its name stands for Data-Driven Documents (3 “D”s), and it’s known as an interactive and dynamic data visualization library for the web.
First released in February 2011, D3’s version 4 was released in June 2016. At the time of writing, the latest stable release is version 4.4, and it is continuously being updated.
D3 leverages the Scalable Vector Graphic, or SVG format, which allows you to render shapes, lines, and fills that can be zoomed in or out without losing quality.
This tutorial will guide you through creating a bar chart using the JavaScript D3 library.
Prerequisites
To make the most use of this tutorial, you should have some familiarity with the JavaScript programming language as well as knowledge of CSS and HTML.
Although you’ll be using CSS to style D3, it’s worth noting that a lot of standard CSS that works on HTML works differently on SVG — that is, you’ll be using stroke instead of border, and fill instead of color. To learn more, you can read the Mozilla Developer Network article on SVG and CSS.
We’ll be using a text editor and a web browser. For testing purposes, it is recommended to use a tool to examine and debug JavaScript, HTML, and CSS such as Firefox Developer Tools, or Chrome DevTools.
Step 1 — Create Files and Reference D3
Let’s start by creating a directory to keep all our files. You can call it whatever you would like, we’ll call it D3-project here. Once it’s created, move into the directory.
- mkdir D3-project
- cd D3-project
To make use of D3’s capabilities, you must include the d3.js file in your web page. It’s about 16,000 lines long and 500kb.
Let’s use curl to download the file to our directory.
To download a compacted version that is better for including with your project, type:
- curl https://d3js.org/d3.v4.min.js --output d3.min.js
If you plan on reading the D3 code, it is probably better to get the uncompressed version with human-friendly whitespace by typing:
- curl https://d3js.org/d3.v4.js --output d3.js
We’ll be using the d3.min.js file throughout this tutorial, but if you opt to use the human-readable version, then reference d3.js in your HTML file instead.
Because D3 version 4 is modular, you can alternatively reduce file size by pulling in only the modules you’ll be using.
With D3 downloaded, let’s set up our CSS and HTML files. You can choose whichever text editor you would like to work on this file, such as nano. We’ll begin with the CSS file, style.css, so that we can immediately link to it from our HTML file.
- nano style.css
We’ll start with a standard CSS declaration to style the page at 100% height and no margin.
html, body {
  margin: 0;
  height: 100%;
}
You can save and close the CSS file for now.
Next we’ll create our JavaScript file, which we’ll name barchart.js because we’re going to be making a bar chart for this example. This file is where the majority of our D3 work will live, which we’ll begin to work on in our next step. Since we don’t need to open the file right now and can use the touch command.
- touch barchart.js
For now, let’s connect all of these elements to an HTML file, which we’ll call barchart.html:
- nano barchart.html
We can set up this file like most other HTML files, and inside it we’ll reference the style.css and barchart.js files we just created as well as the d3.min.js script.
<!DOCTYPE html>
<html lang="en">
  <head>
    <meta charset="utf-8">
    <title>Bar Chart</title>
    <link rel="stylesheet" type="text/css" href="style.css">

    <!-- Alternatively use d3.js here -->
    <script type="text/javascript" src="d3.min.js"></script>

  </head>

  <body>
    <script type="text/javascript" src="barchart.js"></script>
  </body>
</html>
The HTML file can be saved and closed for now.
Step 2 — Setting Up the SVG in JavaScript
We can now open the barchart.js file with our text editor of choice:
- nano barchart.js
Let’s begin by adding an array of numbers, which we’ll use as the basis for our bar chart:
var dataArray = [23, 13, 21, 14, 37, 15, 18, 34, 30];
Next, we need to create the SVG element. This is where we will place all of our shapes. In D3, we use d3.select to tell the browser to search for elements.
We can do this with the single line d3.select("body").append("svg"); but it would be better if we declare it as a variable so that we can readily reference it in our code later.
var dataArray = [23, 13, 21, 14, 37, 15, 18, 34, 30];

var svg = d3.select("body").append("svg");
If we now load barchart.html into our web browser of choice, we should be able to check the DOM or Document Object Model with our developer tools and mouseover the SVG box. Depending on your browser, it may be quite small.

Back in our JavaScript file, we can chain attributes to the SVG to make it the full height and width of the web page. We’ll be using .attr() for attribute. Though we can keep this all on one line, it is a little more readable to break this up. Make sure that you move your semicolon down to the end of the variable declaration.
var dataArray = [23, 13, 21, 14, 37, 15, 18, 34, 30];

var svg = d3.select("body").append("svg")
          .attr("height","100%")
          .attr("width","100%");
If you reload the page in your browser, you should see a rectangle that takes up the full screen when you mouseover the DOM.
Step 3 — Adding Rectangles
With our SVG ready to go, we can begin adding rectangles of our data set to the JavaScript file.
var dataArray = [23, 13, 21, 14, 37, 15, 18, 34, 30];

var svg = d3.select("body").append("svg")
          .attr("height","100%")
          .attr("width","100%");

svg.selectAll("rect")
    .data(dataArray)
    .enter().append("rect");
Like with d3.select above, we’re telling the browser to search for elements. This time, it’s for an array of rectangles. Since it’s an array, we use d3.selectAll and we use d3.selectAll("rect") because it’s an array of rectangles. If the browser finds rectangles, it will return them in a selection, if it’s empty it will be returned empty. With D3 you have to first select the elements you’re about to act on.
We tie this rectangle array to the data stored in dataArray with .data(dataArray).
To actually add a rectangle for each item in the selection (that corresponds to the data array), we’ll also add .enter().append("rect"); to append the rectangles. In this example, there will be 9 rectangles to correspond to the 9 numbers in the array.
If you reload your page now, you won’t see any rectangles yet, but if you check the DOM, you’ll see 9 rectangles defined there.

We have not yet set attributes for the rectangles to make them visible, so let’s add those in.
Setting Attributes for Shapes
We can add attributes to shapes in the same way that we defined attributes for the SVG, by using .attr(). Each shape in D3 will have different attributes depending on how they are defined and drawn.
Our rectangles will take in 4 attributes:
("height", "height_in_pixels")for the height of the rectangles("width", "width_in_pixels")for the width of the rectangles("x", "distance_in_pixels")for their distance from the left side of the browser window("y", "distance_in_pixels")for their distance from the top of the browser window
So, if we want rectangles that are, say, 250 pixels tall, 40 pixels wide, 25 pixels from the left side of the browser, and 50 pixels from the top, we’ll write our code as follows:
var dataArray = [23, 13, 21, 14, 37, 15, 18, 34, 30];

var svg = d3.select("body").append("svg")
          .attr("height","100%")
          .attr("width","100%");

svg.selectAll("rect")
    .data(dataArray)
    .enter().append("rect")
          .attr("height","250")
          .attr("width","40")
          .attr("x","25")
          .attr("y","50");
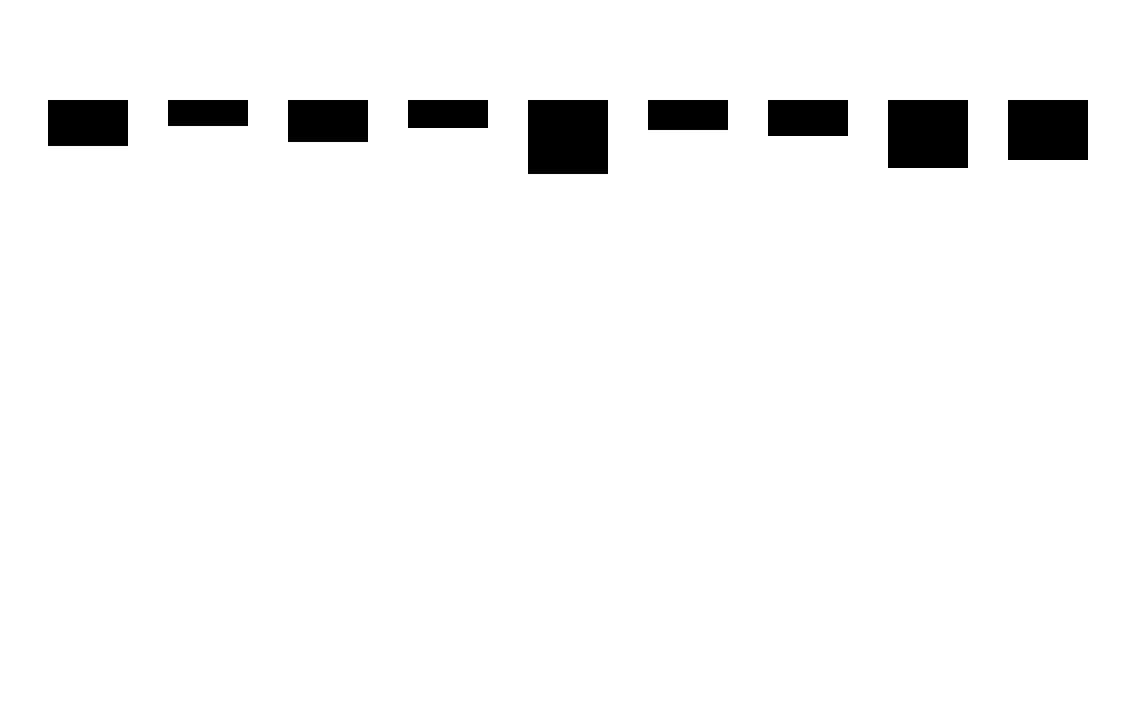
If we refresh the browser we’ll see all of the rectangles overlapping:

By default, shapes in D3 are filled black in color, but we can modify that later as we need to first address the positioning and size of the rectangles.
Making the Rectangles Reflect the Data
Currently, all of the rectangles in our array have the same position along the X-axis, and are not representing the data in terms of height.
To modify the position and size of the rectangles, we’ll need to introduce functions for some of our attributes. Adding the functions will make the value dynamic rather than manual.
Let’s start with modifying the x attribute. Currently that line of code looks like this:
.attr("x","25")
We’ll be replacing the figure of 25 pixels with a function. We’ll pass two variables defined by D3 to function(), standing for data point and index. The index tells us the position of the data point within the array. It’s convention to use d for data point and i for index, as in function(d, i), but you can use whatever variables you want.
JavaScript will iterate through d and i. Let’s have it add spacing for each index it iterates over, so that each rectangle is spaced out. To accomplish this, we can multiply the index i by a certain number of pixels. We’ll use 60 for now, but you can decide which spacing looks right for you. Our new line for the X-axis attribute now looks like this:
.attr("x", function(d, i) {return i * 60;})
However, if we run the code now, we’ll see that the rectangles are flush up against the left side of the browser, so let’s add some additional spacing there, say 25 pixels from the edge. Now our full code should look like this:
var dataArray = [23, 13, 21, 14, 37, 15, 18, 34, 30];

var svg = d3.select("body").append("svg")
          .attr("height","100%")
          .attr("width","100%");

svg.selectAll("rect")
    .data(dataArray)
    .enter().append("rect")
          .attr("height","250")
          .attr("width","40")
          .attr("x", function(d, i) {return (i * 60) + 25})
          .attr("y","50");
And if we refresh the browser at this point, we’ll see something that looks like this:

Now we have our rectangles spaced out along the X-axis, representative of each of the items in our array. Next, let’s have the height of the rectangles reflect the data in the array.
We’ll be working now with the height attribute, and will be adding a function similar to what we’ve added to the x attribute. Let’s start by passing the variables d and i to function, and return d. Recall that d stands for data point.
.attr("height", function(d, i) {return (d)})
If you run the code now, you’ll notice two things. First that the rectangles are rather small, and second that they are attached to the top of the chart rather than the bottom.
To address the small size of the rectangles, let’s multiply the d that is returned:
.attr("height", function(d, i) {return (d * 10)})
Now the size of the rectangles are larger, but they’re still being displayed top to bottom.
Browsers generally read web pages from top left to bottom right, while we read bar charts from bottom to top. To reposition the rectangles, we’ll modify the y attribute to subtract the space on top.
Again, we’ll use function(d, i), and we’ll return a Y value that is taller than our bar chart’s tallest value, let’s say 400. We’ll subtract the returned height of (d * 10) from 400, so that our line now looks like this:
.attr("y", function(d, i) {return 400 - (d * 10)});
Let’s look at our full JavaScript code:
var dataArray = [23, 13, 21, 14, 37, 15, 18, 34, 30];

var svg = d3.select("body").append("svg")
          .attr("height","100%")
          .attr("width","100%");

svg.selectAll("rect")
    .data(dataArray)
    .enter().append("rect")
          .attr("height", function(d, i) {return (d * 10)})
          .attr("width","40")
          .attr("x", function(d, i) {return (i * 60) + 25})
          .attr("y", function(d, i) {return 400 - (d * 10)});
At this point, when we reload our page we’ll see a bar chart that we can read bottom to top:

Now, we can work on styling the chart.
Step 4 — Styling with D3
We’ll be working with our CSS file to style our D3 shapes, but first, to make this work easier, we’ll give our rectangles a class name in the JavaScript file that we can reference in our CSS file.
Adding a class is just like adding any of the other attributes using dot notation. We’ll call the class bar, since it’s a bar chart, but we can call it whatever we want as long as all the references refer to the same name. Our syntax will look like this:
.attr("class", "bar")
We can add this attribute wherever we’d like. Keeping it as the first attribute can make it easier to refer to in our CSS file.
var dataArray = [23, 13, 21, 14, 37, 15, 18, 34, 30];

var svg = d3.select("body").append("svg")
          .attr("height","100%")
          .attr("width","100%");

svg.selectAll("rect")
    .data(dataArray)
    .enter().append("rect")
          .attr("class", "bar")
          .attr("height", function(d, i) {return (d * 10)})
          .attr("width","40")
          .attr("x", function(d, i) {return (i * 60) + 25})
          .attr("y", function(d, i) {return 400 - (d * 10)});
Now, let’s switch into our style.css file, that currently looks like this:
html, body {
  margin: 0;
  height: 100%
}
We can start to modify our rectangles by changing their fill color, referencing the bar class we just created:
html, body {
  margin: 0;
  height: 100%
}

.bar {
  fill: blue
}
Here, we have made the rectangles blue, and we can alternatively assign them a hex color code, as in:
.bar {
  fill: #0080FF
}
At this point, our rectangles look like this:

We can give additional values to the rectangles, such as stroke to outline the rectangles in a particular color, and a stroke-width:
html, body {
  margin: 0;
  height: 100%
}

.bar {
  fill: #0080FF;
  stroke: black;
  stroke-width: 5
}
This will provide our rectangles with a black outline of 5 pixels in width.

Additionally, we can add a touch of interactivity to our chart by adding styling for the bar color to change on mouse hover:
.bar:hover {
  fill: red
}
Now, when we mouseover one of the rectangles, that particular rectangle will change red:

Alternatively, you can style the shapes in your JavaScript file by adding additional attributes. In the rectangle block, we will write these like the other .attr() attributes. So, adding a black stroke around the rectangles will be written as .attr("stroke", "black"). Let’s also add a stroke-width of 5 pixels, and be sure to move the semicolon down.
...
svg.selectAll("rect")
    .data(dataArray)
    .enter().append("rect")
          .attr("class", "bar")
          .attr("height", function(d, i) {return (d * 10)})
          .attr("width","40")
          .attr("x", function(d, i) {return (i * 60) + 25})
          .attr("y", function(d, i) {return 400 - (d * 10)})
          .attr("stroke", "black")
          .attr("stroke-width", "5");
The choice is up to you how you decide to style your shapes and in what file. In this example, we’ll work in the style.css file and keep it limited to fill color and hover fill:
html, body {
  margin: 0;
  height: 100%
}

.bar {
  fill: #0080FF
}

.bar:hover {
  fill: #003366
}
When working with colors on the web, it is important to keep your audience in mind and work to include colors that are as universally accessible as possible. To learn more about color accessibility considerations, you can check out Acessibility & Me.
Step 5 — Adding Labels
Our final step is to add some quantifiable markers to our graph in the form of labels. These labels will correspond to the numbers in our array.
Adding text is similar to adding the rectangle shapes that we did above. We’ll need to select the text, then append it to the SVG. We’ll also tie it to the dataArray we created. Instead of "rect", we’ll use "text", but the general format is similar to what we did to add the rectangles above. We will add these lines to the bottom of our barchart.js file.
var dataArray = [23, 13, 21, 14, 37, 15, 18, 34, 30];

var svg = d3.select("body").append("svg")
          .attr("height","100%")
          .attr("width","100%");

svg.selectAll("rect")
    .data(dataArray)
    .enter().append("rect")
          .attr("class", "bar")
          .attr("height", function(d, i) {return (d * 10)})
          .attr("width","40")
          .attr("x", function(d, i) {return (i * 60) + 25})
          .attr("y", function(d, i) {return 400 - (d * 10)});

svg.selectAll("text")
    .data(dataArray)
    .enter().append("text")
    .text(function(d) {return d;});
When we refresh our browser, we won’t see any text on the page, but we’ll see it again in our DOM:

If you mouse over the lines of text in the DOM, you’ll see that the text is all located on the top of the page, where X and Y equal 0. We’ll modify the position by using the same function formulas that we used for the rectangles by adding attributes.
...
svg.selectAll("text")
    .data(dataArray)
    .enter().append("text")
    .text(function(d) {return d})
          .attr("x", function(d, i) {return (i * 60) + 25})
          .attr("y", function(d, i) {return 400 - (d * 10)});
When you load the web page now, you’ll see numbers floating above the bars.

It’s worth noting that because this is SVG and not an image, you can select the text just like with any other text you see on a page.
From here, you can start to reposition the numbers by modifying the function formulas. You may want to keep them floating above the bars, for example:
...
svg.selectAll("text")
    .data(dataArray)
    .enter().append("text")
    .text(function(d) {return d})
          .attr("x", function(d, i) {return (i * 60) + 36})
          .attr("y", function(d, i) {return 390 - (d * 10)});
Alternatively, you can have the numbers float over the rectangles themselves by modifying their position in terms of the Y-axis. We’ll also want to make this more readable, so let’s add a class that we can access from our style.css file.
...
svg.selectAll("text")
    .data(dataArray)
    .enter().append("text")
    .text(function(d) {return d})
          .attr("class", "text")
          .attr("x", function(d, i) {return (i * 60) + 36})
          .attr("y", function(d, i) {return 415 - (d * 10)});
In our style.css file, we’ll make the text white and sans-serif, by adding the following lines to the bottom of our file.
...
.text {
  fill: white;
  font-family: sans-serif
}

You can modify the text as much as you want through positioning and styling. For example, you may also want to change the font-size attribute in the style.css file.
Finished Code and Code Improvements
At this point, you should have a fully functioning bar chart rendered in JavaScript’s D3 library. Let’s look at all of our code files.
<!DOCTYPE html>
<html lang="en">
  <head>
    <meta charset="utf-8">
    <title>Bar Chart</title>

    <!-- Reference style.css -->
    <link rel = "stylesheet" type="text/css" href="style.css">

    <!-- Reference minified version of D3 -->
    <script type="text/javascript" src="d3.min.js"></script>
  </head>

  <body>
    <script type="text/javascript" src="barchart.js"></script>
  </body>
</html>
html, body {
  margin: 0;
  height: 100%
}

/*Rectangle bar class styling*/

.bar {
  fill: #0080FF
}

.bar:hover {
  fill: #003366
}

/*Text class styling*/

.text {
  fill: white;
  font-family: sans-serif
}
// Create data array of values to visualize
var dataArray = [23, 13, 21, 14, 37, 15, 18, 34, 30];

// Create variable for the SVG
var svg = d3.select("body").append("svg")
          .attr("height","100%")
          .attr("width","100%");

// Select, append to SVG, and add attributes to rectangles for bar chart
svg.selectAll("rect")
    .data(dataArray)
    .enter().append("rect")
          .attr("class", "bar")
          .attr("height", function(d, i) {return (d * 10)})
          .attr("width","40")
          .attr("x", function(d, i) {return (i * 60) + 25})
          .attr("y", function(d, i) {return 400 - (d * 10)});

// Select, append to SVG, and add attributes to text
svg.selectAll("text")
    .data(dataArray)
    .enter().append("text")
    .text(function(d) {return d})
           .attr("class", "text")
           .attr("x", function(d, i) {return (i * 60) + 36})
           .attr("y", function(d, i) {return 415 - (d * 10)});
This code is fully working, but there is a lot that you can do to improve the code. For example, you can leverage the SVG group element to group SVG elements together, allowing you to modify your text and rectangles in fewer lines of code.
You can also access data in different ways. We used an array to hold our data, but you may want to visualize data you already have access to, and it may be considerably more data than what would work well in an array. D3 will allow you to work with several different data file types:
- HTML
- JSON
- Plain text
- CSV (comma-separated values)
- TSV (tab-separated values)
- XML
For example, you can have a JSON file in your website’s directory and connect it to the JavaScript file
d3.json("myData.json", function(json) {
// code for D3 charts in here
});
You can also combine the D3 library with other interactive features you may already know from vanilla JavaScript.
Conclusion
This tutorial went through creating a bar chart in the JavaScript D3 library. You can learn more about d3.js by visiting the D3 API on GitHub.
Other programming languages offer other ways to visualize data that are not limited to web browsers. From here, you can learn how to use matplotlib to plot data with Python.
Thanks for learning with the DigitalOcean Community. Check out our offerings for compute, storage, networking, and managed databases.
author
This textbox defaults to using Markdown to format your answer.
You can type !ref in this text area to quickly search our full set of tutorials, documentation & marketplace offerings and insert the link!


Get our biweekly newsletter
Sign up for Infrastructure as a Newsletter.

Hollie's Hub for Good
Working on improving health and education, reducing inequality, and spurring economic growth? We'd like to help.

Become a contributor
Get paid to write technical tutorials and select a tech-focused charity to receive a matching donation.

Thank you so much for this, I was thrashing around in a forest of brain-mulching nightmares and there was a thick soup of things beginning with ‘n’ before I found you :)
Interesting tutorial. Personally I prefer Chart.js.
Very good tutorial. Like the way it builds in small steps rather than large, unexplained leaps. However, I have a question as to whether you have implemented your last suggestion about retrieving local data: d3.json(“myData.json”, function(json) { // code for D3 charts in here } My attempts resulted in a CORS error. In order to serve data, I used a simple Express.js server with CORS headers processing to deliver json data. Your workarounds? David